01 · SeSDA
Earthquake sequence
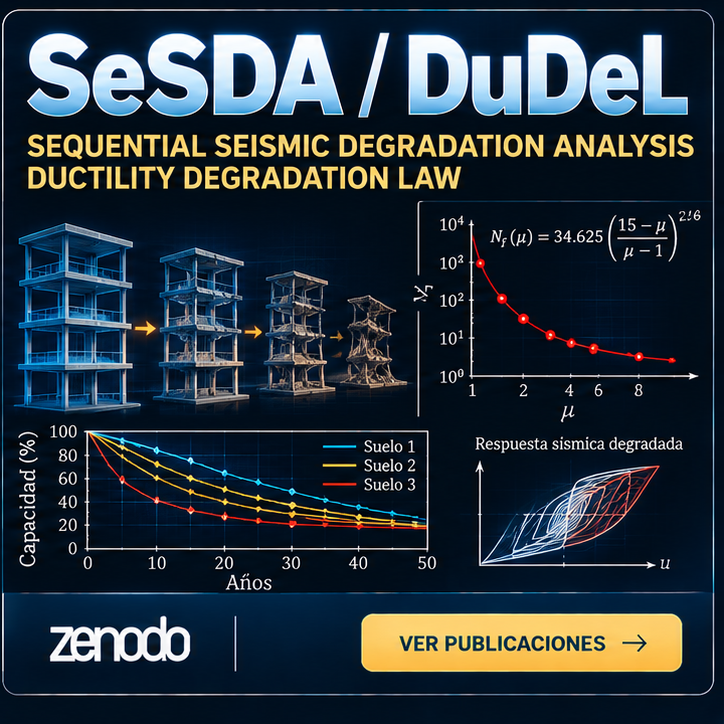
Applies multiple ground-motion records over the service life, carrying the deformed and degraded state forward between events.
Sequential seismic degradation analysis method
SeSDA analyzes how the load-bearing capacity of a structure decreases under multiple earthquakes. It applies the Ductility Degradation Law (DuDeL) after each inelastic excursion and retains the structural state for subsequent events. This case study uses inelastic hPIM (2PIM) for step-by-step integration of the dynamic response.
Author: M.Sc. (TUM) Marcelo Moncayo Theurer · Guayaquil, Ecuador · 2026
 SEQUENCES AND DEGRADATION
 2PIM TIME INTEGRATION
A structure does not start each earthquake from an undamaged state: earlier plastic excursions change its remaining strength and produce residual displacements.
Applies multiple ground-motion records over the service life, carrying the deformed and degraded state forward between events.
Quantifies the loss of yield strength based on the ductility reached during each inelastic excursion.
Computes displacements, forces and dynamic response step by step. The hPIM paper reports preliminary accuracy comparisons with Newmark.
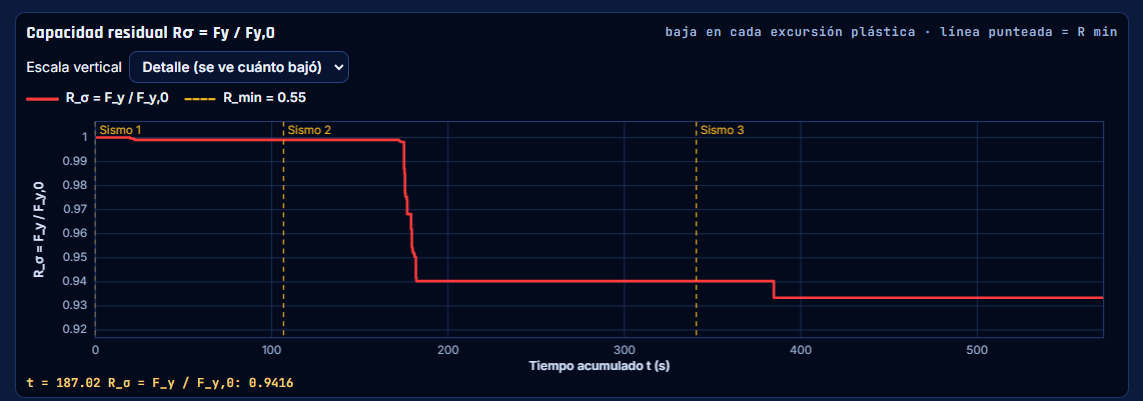
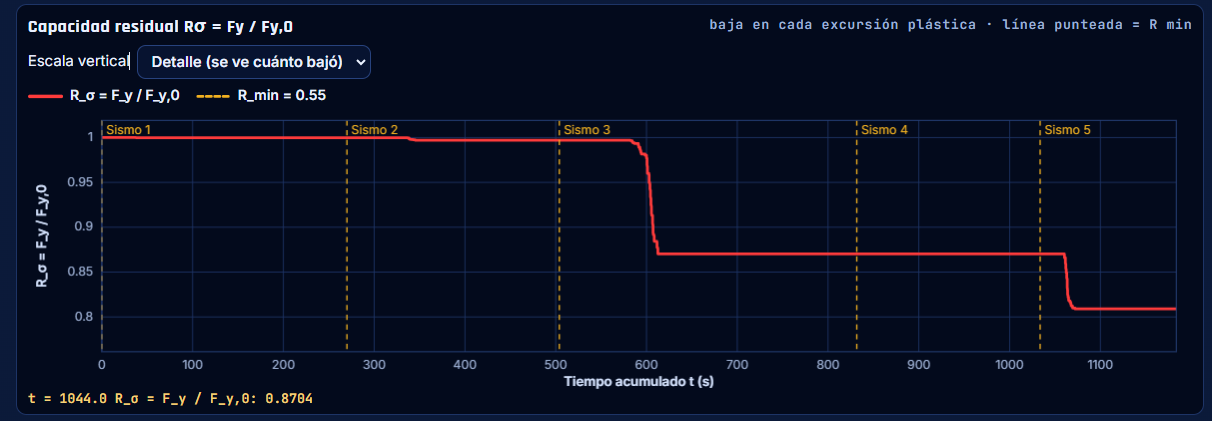
The paper proposes the acceptance threshold Fᵧ,final / Fᵧ,0 ≥ 0.55. The system reports whether the condition is met.
SeSDA defines an explicit law to update strength after ductile excursions and uses a numerical time integrator to compute structural response to each acceleration record.
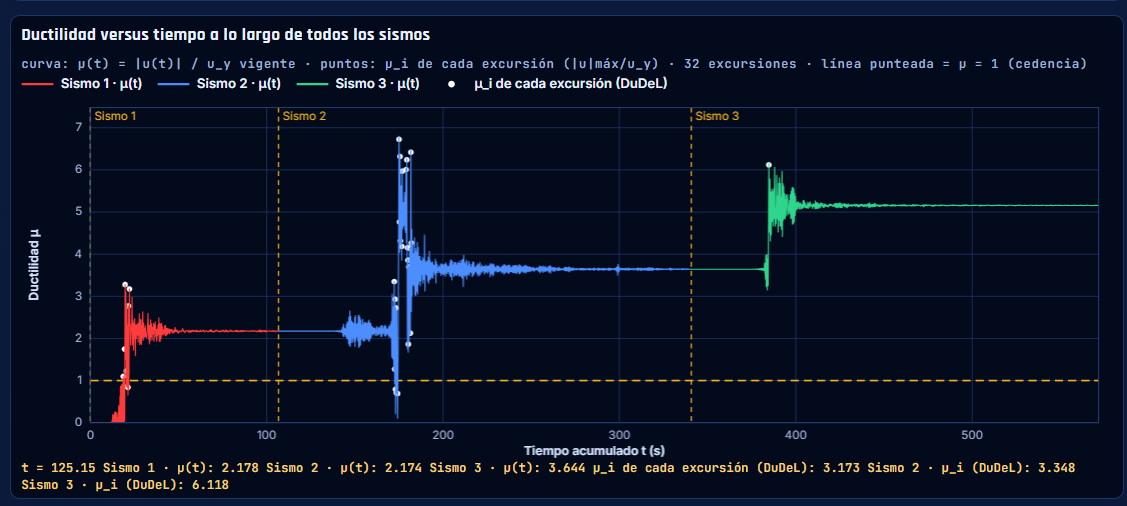
Nf is the equivalent number of excursions at ductility μ, defined for 1 < μ < 15. Ductility is calculated as μ = umax/uy.
Each plastic excursion reduces the available yield strength relative to the initial Fy,0. The remaining strength is retained when the next earthquake begins.
The hPIM paper presents preliminary validation for linear systems; the case study shown here is an inelastic 2PIM application within SeSDA.
The first available case study includes New Zealand (2010), Türkiye (2023) and Myanmar (2025). It evaluates inelastic excursions, strength, residual displacement and energy balance. Additional examples will be added in later versions.
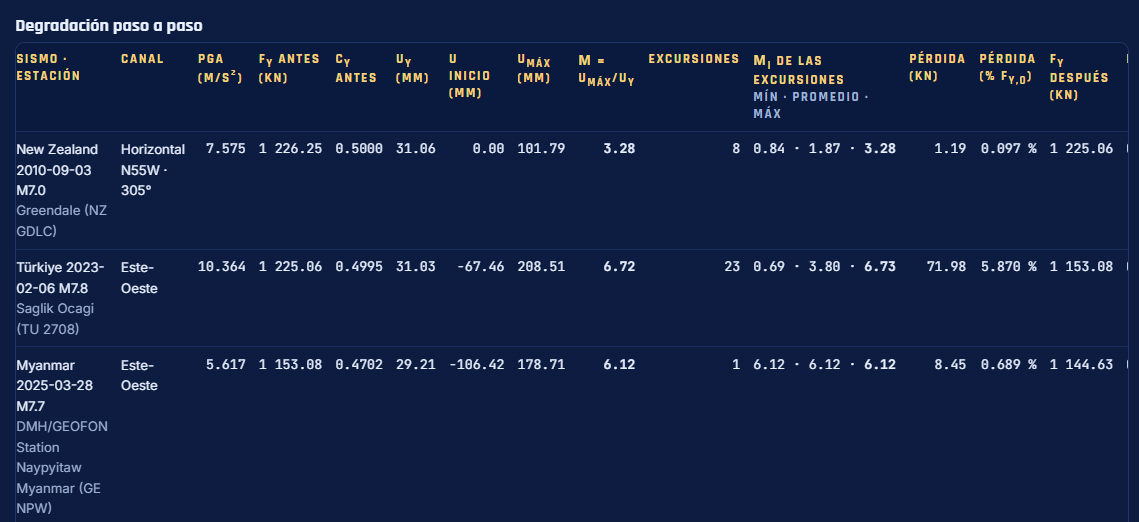
| Earthquake / station | Component | PGA (m/s²) | Fᵧ before (kN) | Cᵧ before | uᵧ (mm) | Initial u (mm) | u max (mm) | Ductility μ | Excursions | Excursion μ: min / mean / max | Loss (kN) | Strength loss (%) | Fᵧ after (kN) |
|---|---|---|---|---|---|---|---|---|---|---|---|---|---|
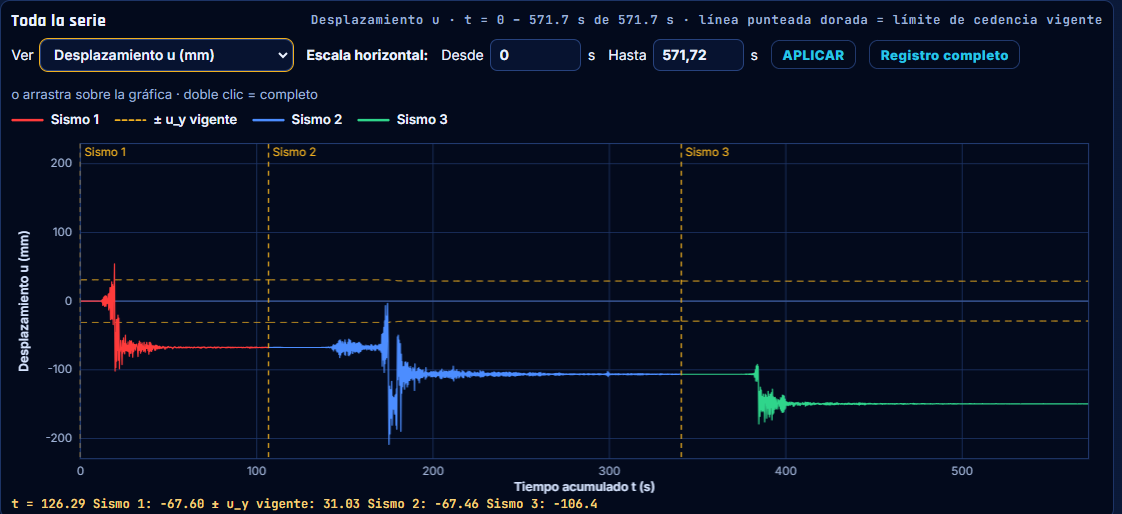
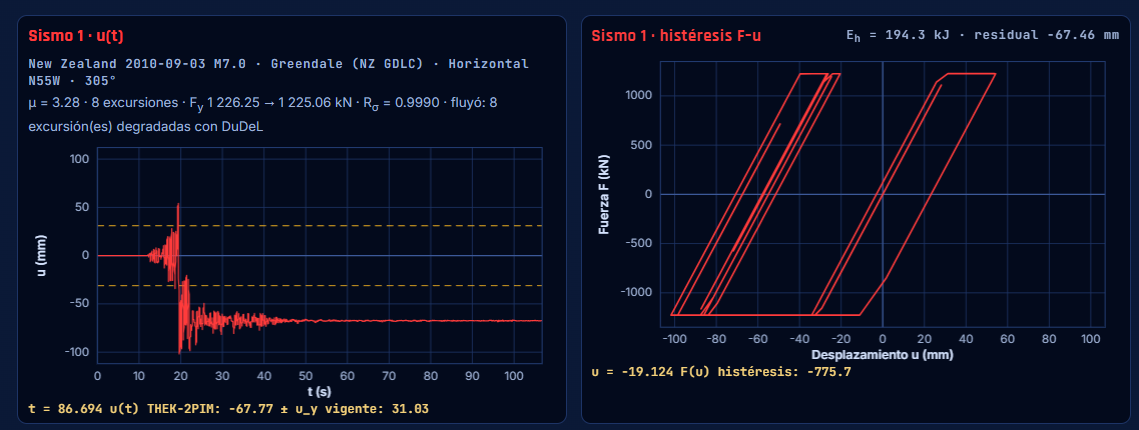
| New Zealand · 2010-09-03 · M7.0 — Greendale (NZ GDLC) | Horizontal N55W · 305° | 7.575 | 1 226.25 | 0.5000 | 31.06 | 0.00 | 101.79 | 3.28 | 8 | 0.84 / 1.87 / 3.28 | 1.19 | 0.097 % | 1 225.06 |
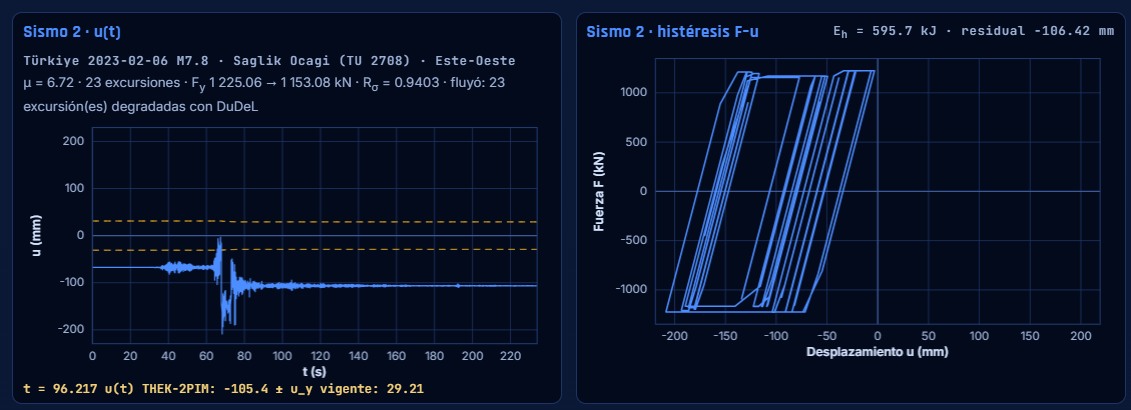
| Türkiye · 2023-02-06 · M7.8 — Sağlık Ocağı (TU 2708) | Este–Oeste | 10.364 | 1 225.06 | 0.4995 | 31.03 | −67.46 | 208.51 | 6.72 | 23 | 0.69 / 3.80 / 6.73 | 71.98 | 5.870 % | 1 153.08 |
| Myanmar · 2025-03-28 · M7.7 — Naypyitaw (GE NPW), DMH/GEOFON | Este–Oeste | 5.617 | 1 153.08 | 0.4702 | 29.21 | −106.42 | 178.71 | 6.12 | 1 | 6.12 / 6.12 / 6.12 | 8.45 | 0.689 % | 1 144.63 |
PGA: peak ground acceleration · μ = umax/uy · excursion ductility listed as minimum / mean / maximum · percentage loss relative to the yield strength at the beginning of the event.
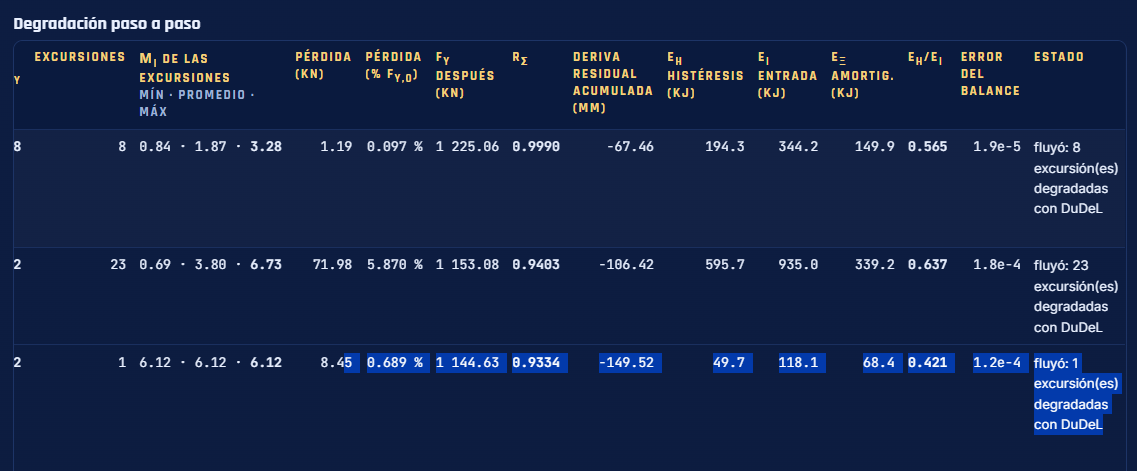
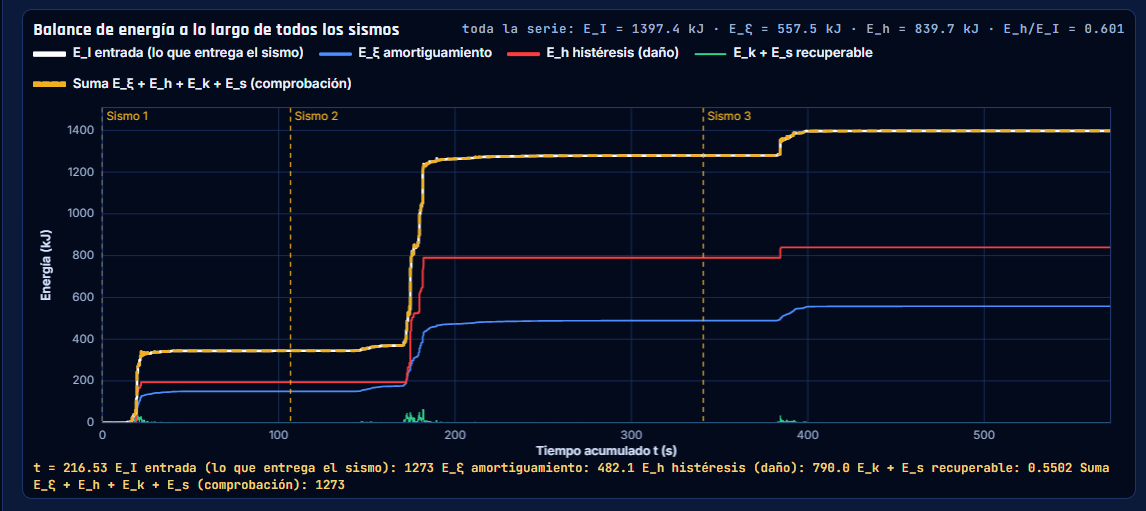
| Earthquake | R = Fᵧ/Fᵧ₀ | Residual displacement (mm) | Eₕ hysteretic (kJ) | Eᵢ input (kJ) | Damping energy (kJ) | Eₕ/Eᵢ | Balance error | DuDeL excursions |
|---|---|---|---|---|---|---|---|---|
| Earthquake 1 | 0.9990 | −67.46 | 194.3 | 344.2 | 149.9 | 0.565 | 1.9 × 10⁻⁵ | 8 |
| Earthquake 2 | 0.9403 | −106.42 | 595.7 | 935.0 | 339.2 | 0.637 | 1.8 × 10⁻⁴ | 23 |
| Earthquake 3 | 0.9334 | −149.52 | 49.7 | 118.1 | 68.4 | 0.421 | 1.2 × 10⁻⁴ | 1 |
Values transcribed from the original case-study screenshots. The table gives energy values for individual earthquakes; sequence totals follow.
All figures preserve the supplied original results. They appear in THEK-framed panels with institutional branding, site URL and bibliographic identifiers.
 THEK
 THEK
 THEK
 THEK
 THEK
 THEK
 THEK
 THEK
 THEK
Figures 1 and 2 preserve the original table panels, while the HTML tables above allow users to read and copy the values.
Note: the nine original technical figure images contain Spanish labels; the accompanying captions, data tables and explanations are provided in English.
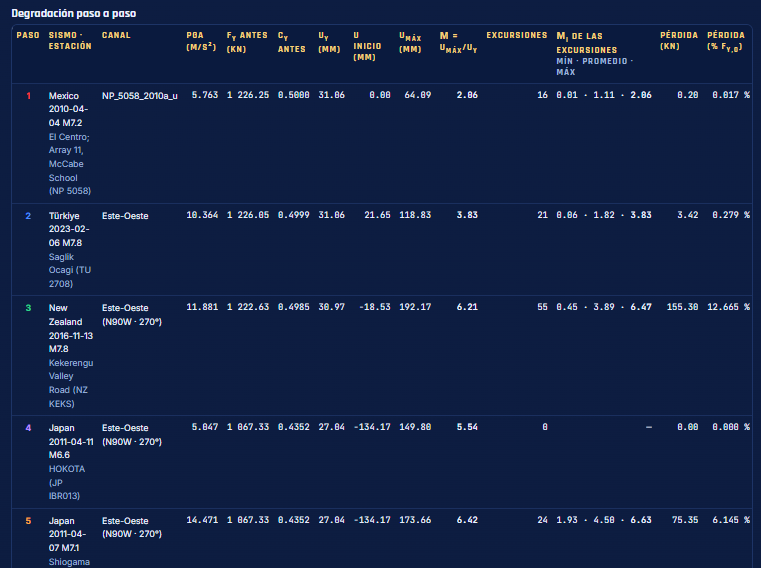
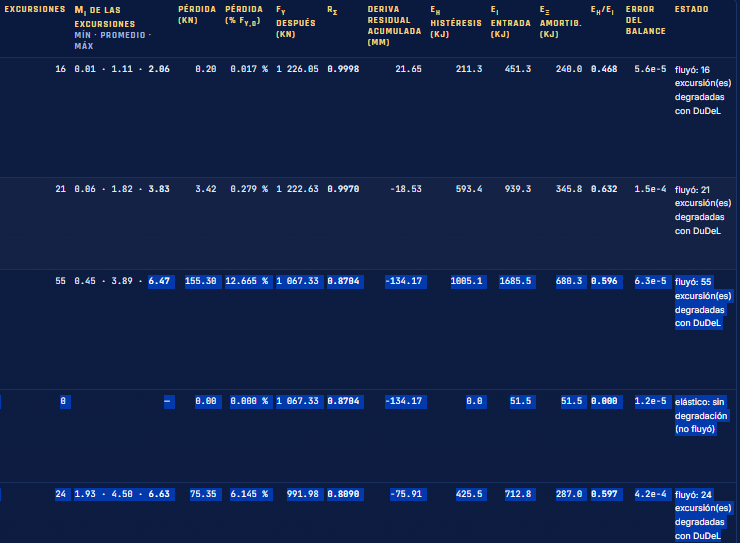
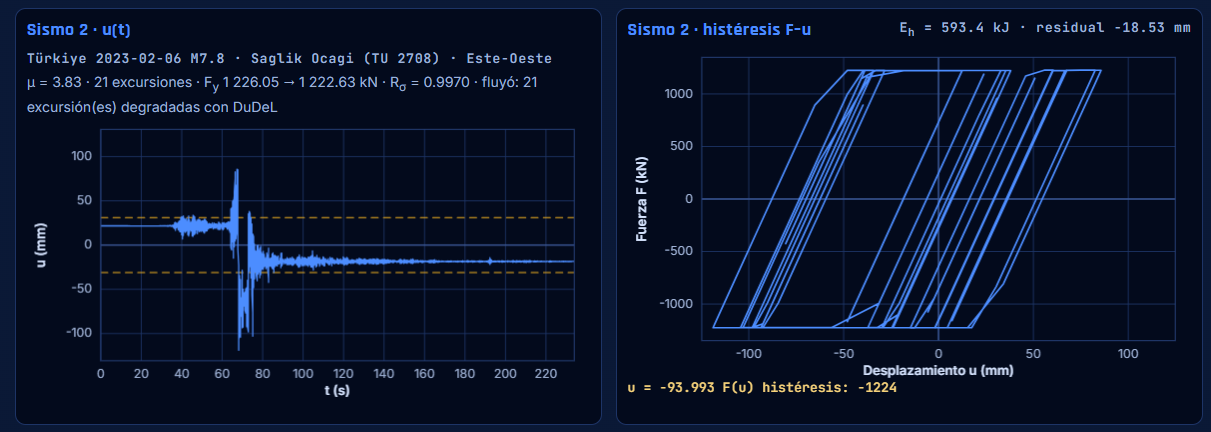
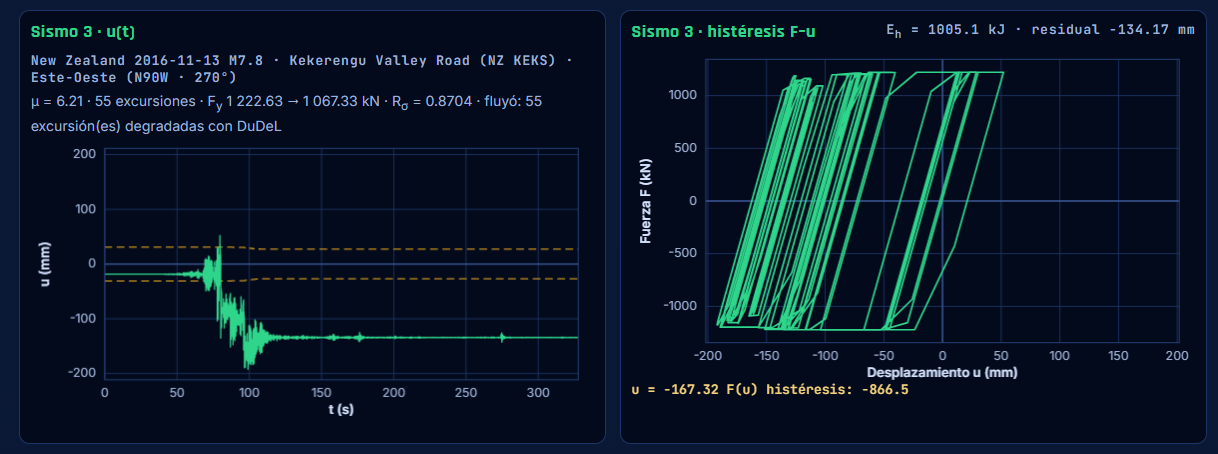
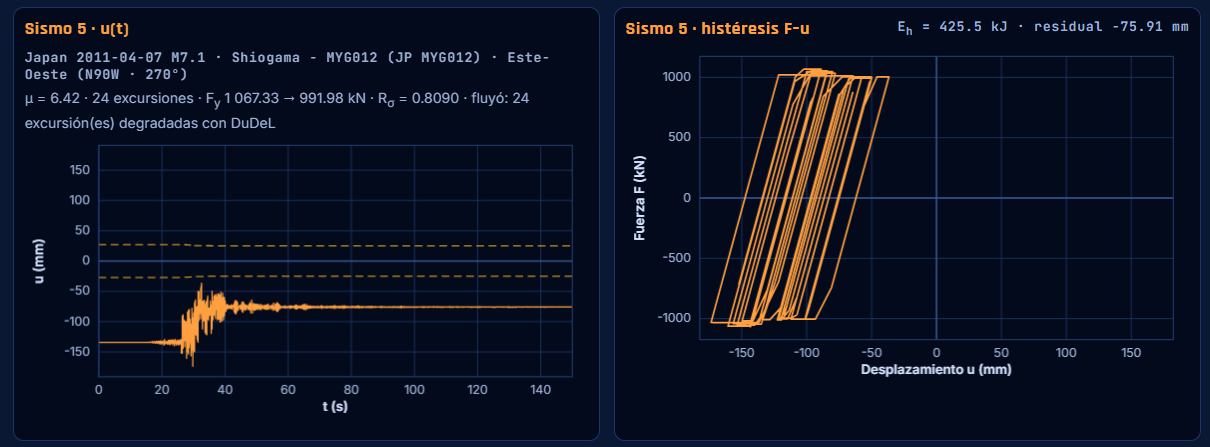
A single structural model is subjected successively to five recorded ground motions. After each earthquake, SeSDA transfers the remaining yield capacity and structural state to the next analysis, applying the DuDeL law at inelastic excursions and the inelastic 2PIM/hPIM time integrator. The event records are a numerical loading sequence; their geographic locations are not the location of the same building, and the dates do not represent a chronological history of the building.
| Step | Earthquake and station | PGA (m/s²) | Maximum ductility μ | Inelastic excursions | Strength loss (kN) | Strength loss (% of Fᵧ,₀) | Fᵧ remaining (kN) | Residual ratio | Eₕ (kJ) | Eᵢ (kJ) | Damping energy (kJ) | Eₕ/Eᵢ |
|---|---|---|---|---|---|---|---|---|---|---|---|---|
| 1 | Mexico · 2010-04-04 · M7.2 · El Centro; Array 11, McCabe School (NP 5058) | 5.763 | 2.06 | 16 | 0.20 | 0.017 | 1226.05 | 0.9998 | 211.3 | 451.3 | 240.0 | 0.468 |
| 2 | Türkiye · 2023-02-06 · M7.8 · Sağlık Ocağı (TU 2708) | 10.364 | 3.83 | 21 | 3.42 | 0.279 | 1222.63 | 0.9970 | 593.4 | 939.3 | 345.8 | 0.632 |
| 3 | New Zealand · 2016-11-13 · M7.8 · Kekerengu Valley Road (NZ KEKS) | 11.881 | 6.21 | 55 | 155.30 | 12.665 | 1067.33 | 0.8704 | 1005.1 | 1685.5 | 680.3 | 0.596 |
| 4 | Japan · 2011-04-11 · M6.6 · HOKOTA (JP IBR013) | 5.847 | 5.54 | 0 | 0.00 | 0.000 | 1067.33 | 0.8704 | 0.0 | 51.5 | 51.5 | 0.000 |
| 5 | Japan · 2011-04-07 · M7.1 · Shiogama (JP MYG012) | 14.471 | 6.42 | 24 | 75.35 | 6.145 | 991.98 | 0.8090 | 425.5 | 712.8 | 287.0 | 0.597 |
This result assesses only the proposed SeSDA residual-strength threshold for the supplied numerical example; it is not an independent verification of a real building or of all code requirements. Earthquake 4 had zero degrading excursions. The original screenshots are retained without fabricated time-history points.
Original calculation output in Spanish; English titles, descriptions, and a complete readable results table are provided.
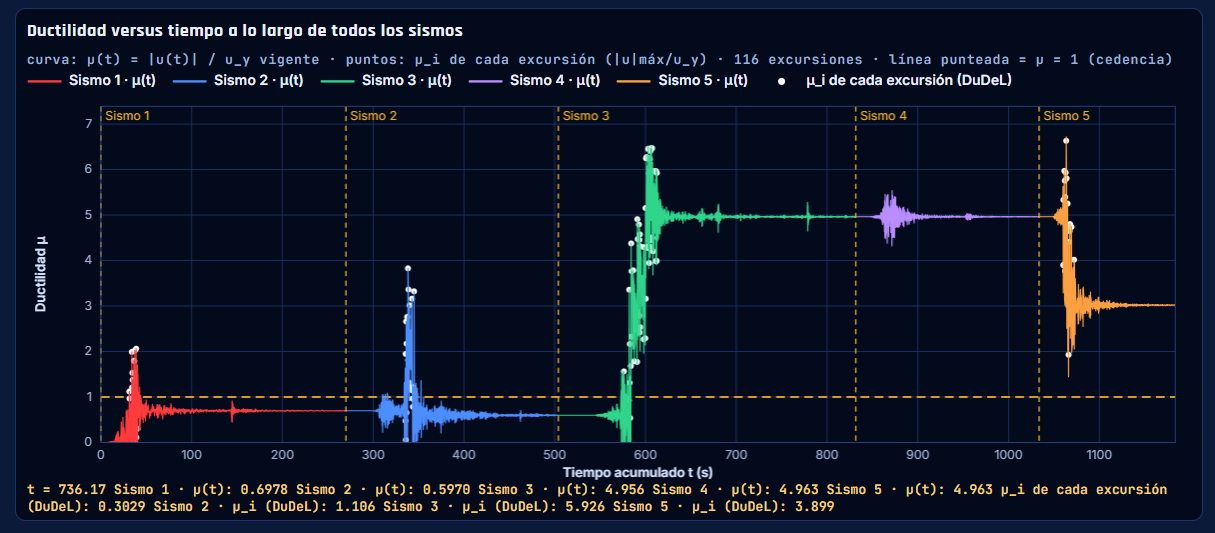
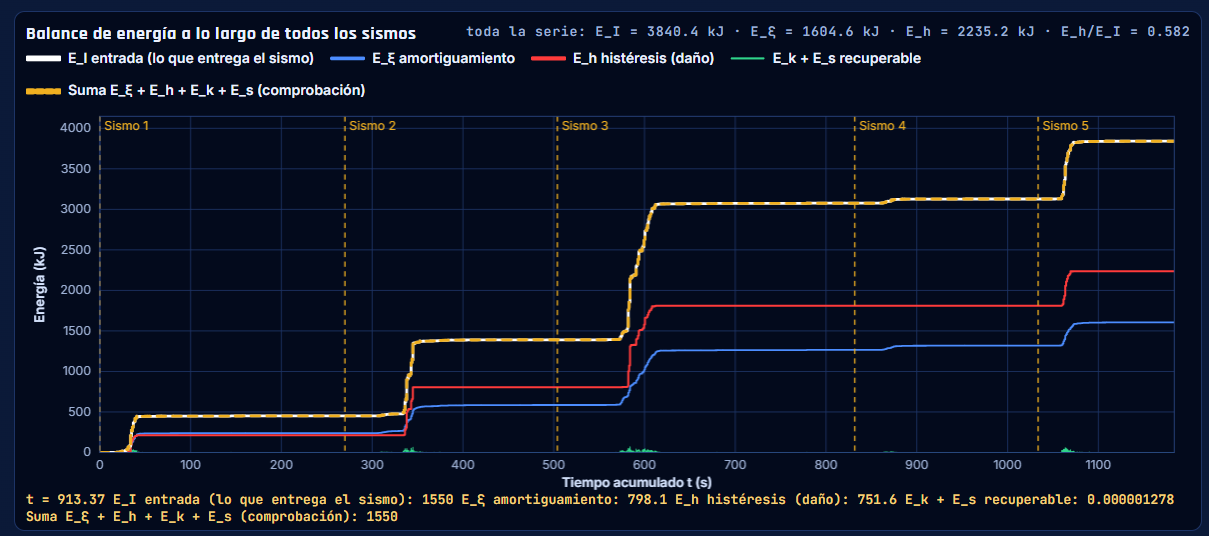
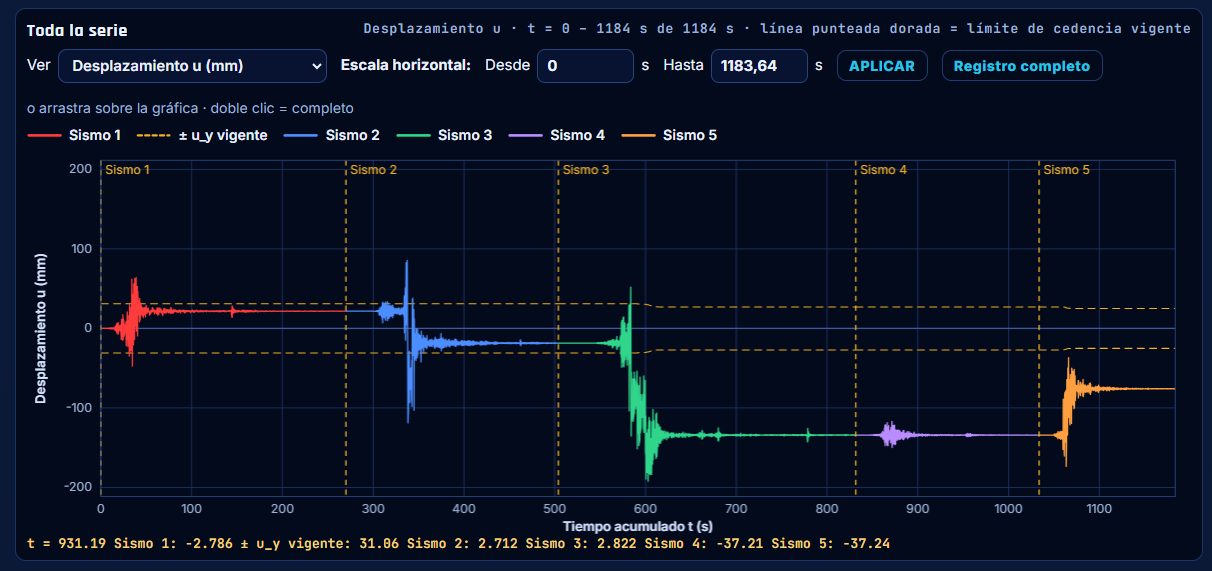
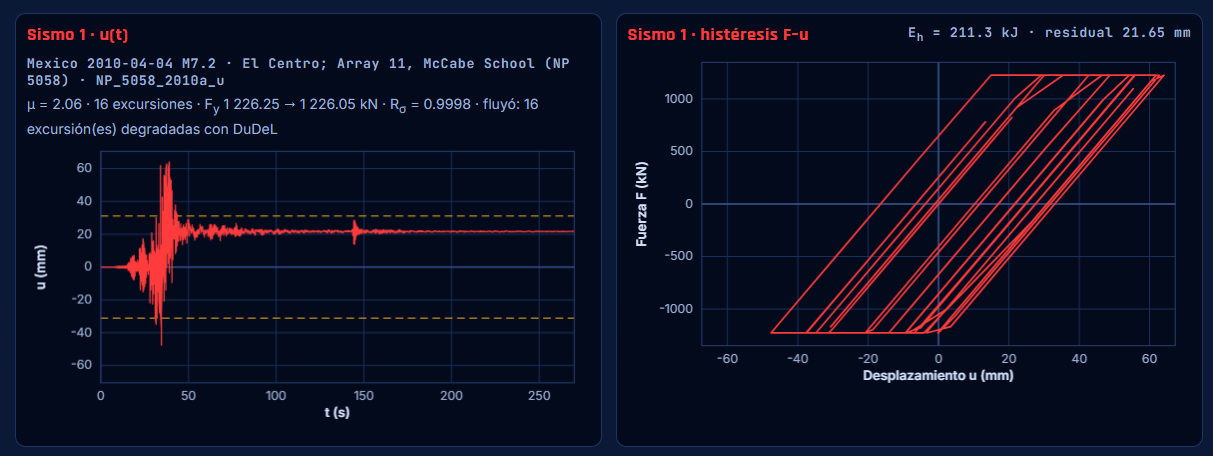

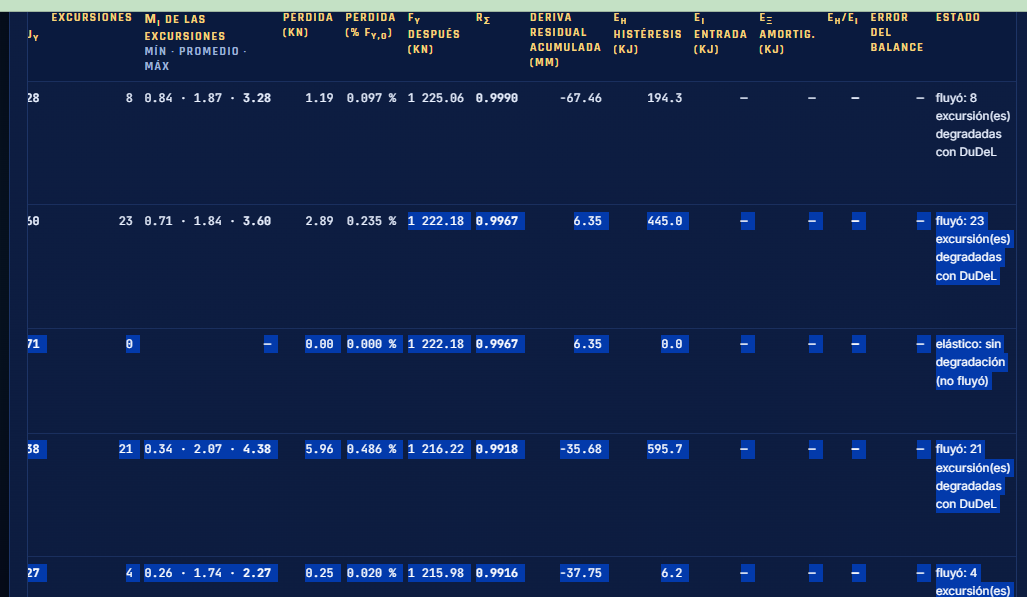
This third numerical example applies a different sequence of five recorded ground motions to the same structural model. SeSDA transfers the residual yield capacity and structural state from one analysis to the next, using DuDeL for degradation and the inelastic 2PIM/hPIM time integration strategy. As in the other examples, the listed earthquakes define a numerical loading sequence; they do not mean that a real building physically traveled among those regions.
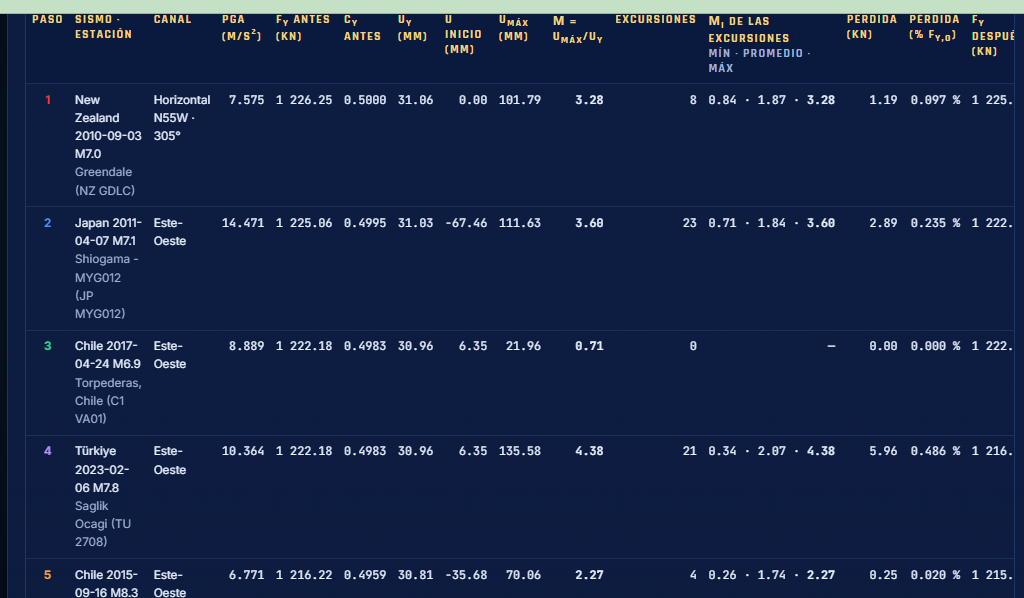
| Step | Earthquake and station | Channel | PGA (m/s²) | Maximum ductility μ | Inelastic excursions | Strength loss (kN) | Strength loss (% of Fᵧ,₀) | Fᵧ remaining (kN) | Residual ratio | Residual displacement (mm) | Eₕ (kJ) |
|---|---|---|---|---|---|---|---|---|---|---|---|
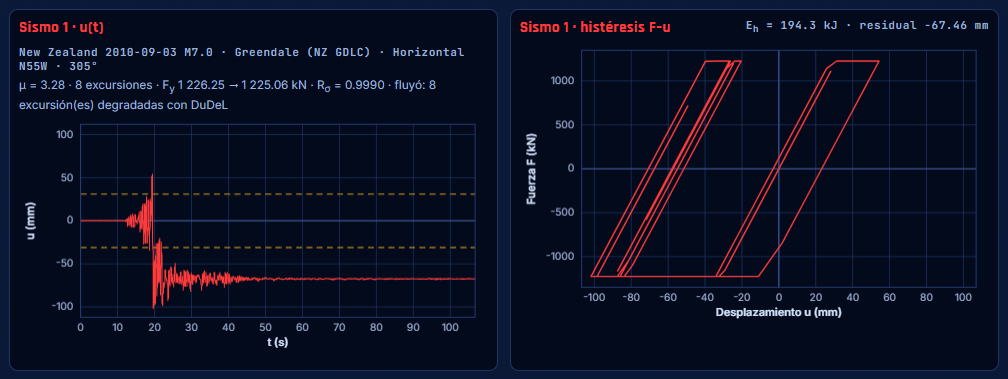
| 1 | New Zealand · 2010-09-03 · M7.0 · Greendale (NZ GDLC) | Horizontal N55W · 305° | 7.575 | 3.28 | 8 | 1.19 | 0.097 | 1225.06 | 0.9990 | -67.46 | 194.3 |
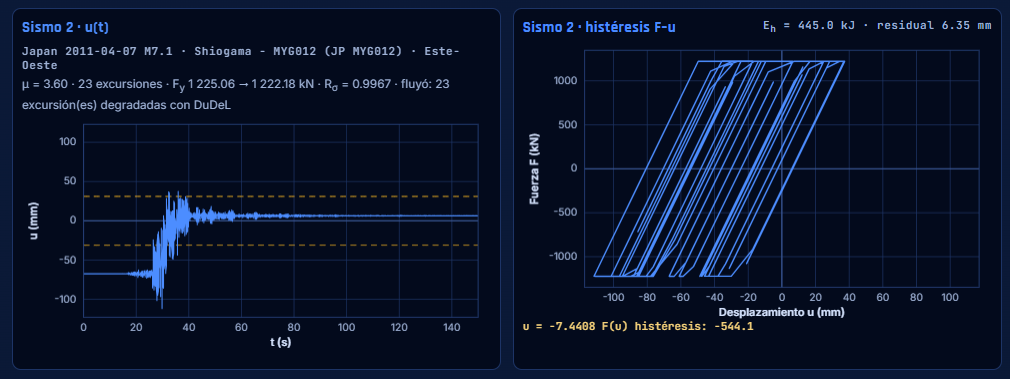
| 2 | Japan · 2011-04-07 · M7.1 · Shiogama (JP MYG012) | East-West | 14.471 | 3.60 | 23 | 2.89 | 0.235 | 1222.18 | 0.9967 | 6.35 | 445.0 |
| 3 | Chile · 2017-04-24 · M6.9 · Torpederas, Chile (C1 VA01) | East-West | 8.889 | 0.71 | 0 | 0.00 | 0.000 | 1222.18 | 0.9967 | 6.35 | 0.0 |
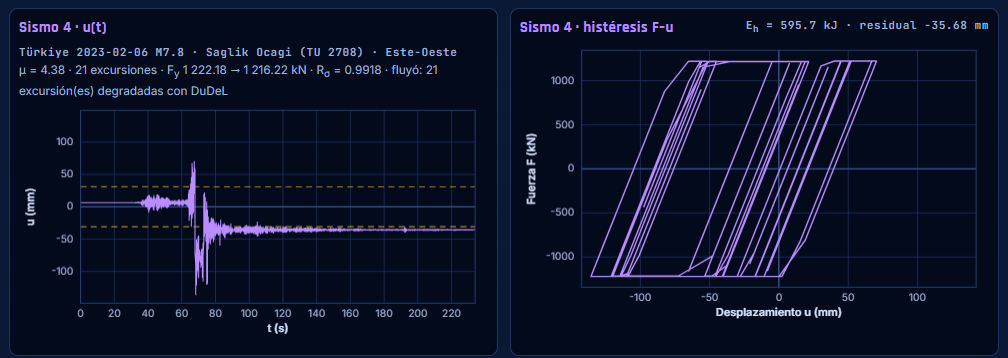
| 4 | Türkiye · 2023-02-06 · M7.8 · Sağlık Ocağı (TU 2708) | East-West | 10.364 | 4.38 | 21 | 5.96 | 0.486 | 1216.22 | 0.9918 | -35.68 | 595.7 |
| 5 | Chile · 2015-09-16 · M8.3 | East-West | 6.771 | 2.27 | 4 | 0.25 | 0.020 | 1215.98 | 0.9916 | -37.75 | 6.2 |
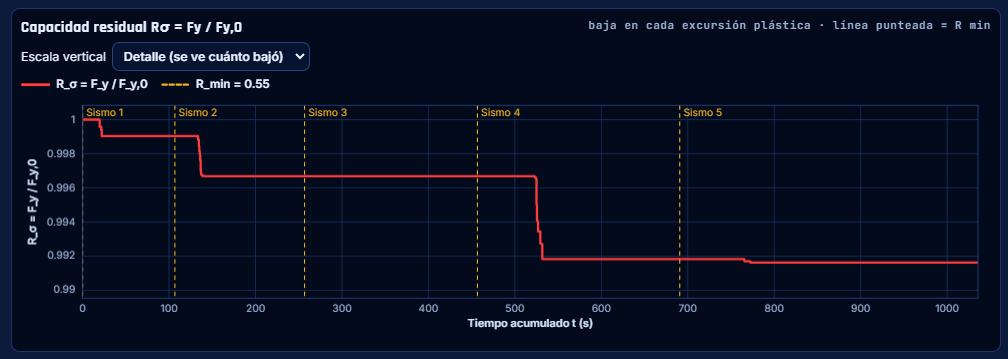
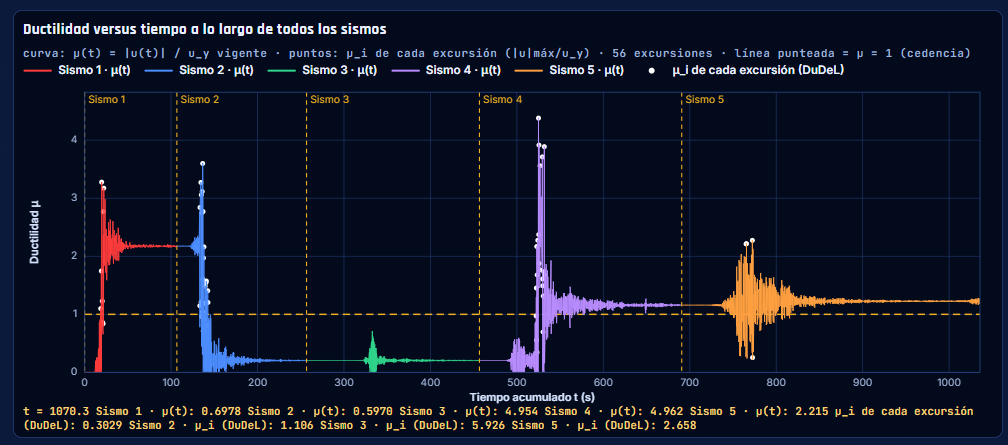
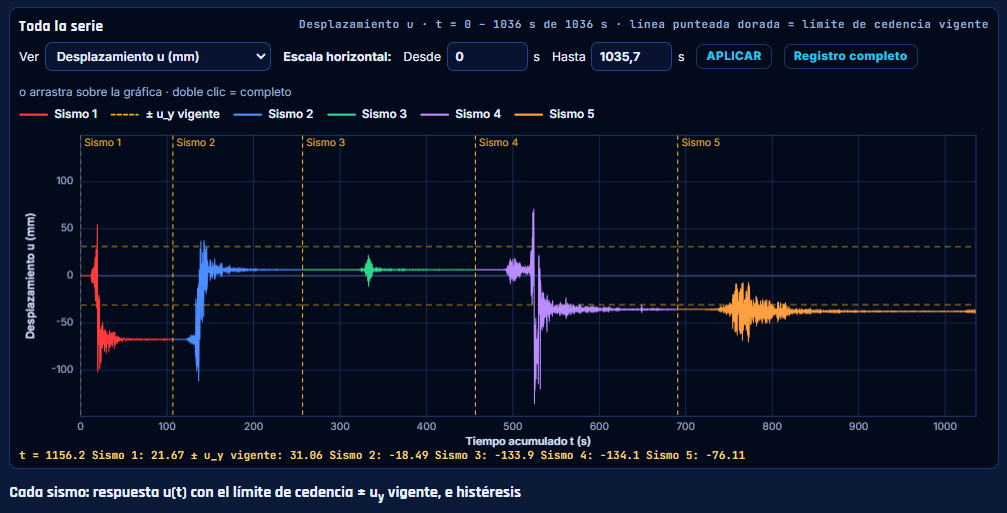
This example shows a comparatively mild cumulative degradation over five earthquakes. The third earthquake remained elastic and therefore produced no degradation, while the fourth earthquake generated the largest hysteretic demand among the supplied event-specific figures. Only the original screenshots provided for this example are included; no missing time-history plots were fabricated.
Original calculation output in Spanish; English titles, descriptions, and a complete readable results table are provided.

Complete documentation of the SeSDA/DuDeL method and the hPIM integrator. Local PDF copies are included and available directly on this website.
Structural analysis and design method for earthquake sequences over the service life using the Ductility Degradation Law (DuDeL). Formulation, residual yield strength and the proposed 55% acceptance threshold.
DOI Zenodo SeSDA: to be confirmed. No DOI is attributed until its association with this publication is verified.
Open SeSDA paper (PDF, Spanish) ↗Formulation, stabilization and preliminary numerical validation of 1PIM and 2PIM for structural dynamics, compared with central differences and Newmark.
Zenodo: 10.5281/zenodo.22746001 ↗
SSRN: 10.2139/ssrn.7568078 ↗
Open hPIM paper (PDF, Spanish) ↗The SeSDA/DuDeL paper is available in English and Spanish; the hPIM paper is supplied in Spanish. These original PDF files are included in the package.
The SeSDA paper is included in both English and Spanish; the hPIM paper is included in Spanish.
Use, implementation and commercial exploitation of the software system require a license from THEK Research Institute. This website presents the method and its results; it does not provide public access to the computational engine.
THEK Research Institute welcomes inquiries about academic collaboration, method applications, consulting, implementation and its scientific publications.
© 2026 THEK Research Institute and Marcelo Moncayo Theurer. Papers are provided for reference; access to PDFs does not grant a software license.